The number your Nginx access log reports for a given day and the number GA4 reports as sessions for the same day will not match. They never do. On a typical content site, I've seen GA4 run 15–30% lower than server-side request counts. On a site with aggressive ad-blocker penetration in a tech-savvy audience, that gap can reach 45%. And occasionally — this surprises people — GA4 can report more sessions than your server logged. Each of these scenarios has a different cause and a different response.
The mistake most people make is treating this as a data quality problem to be solved. It isn't. It's a definitional difference between two fundamentally unlike measurements. The path forward is understanding what each source is actually counting, mapping the specific sources of divergence, and building a reconciliation approach that lets you use both numbers with appropriate confidence.
What Each Number Actually Counts
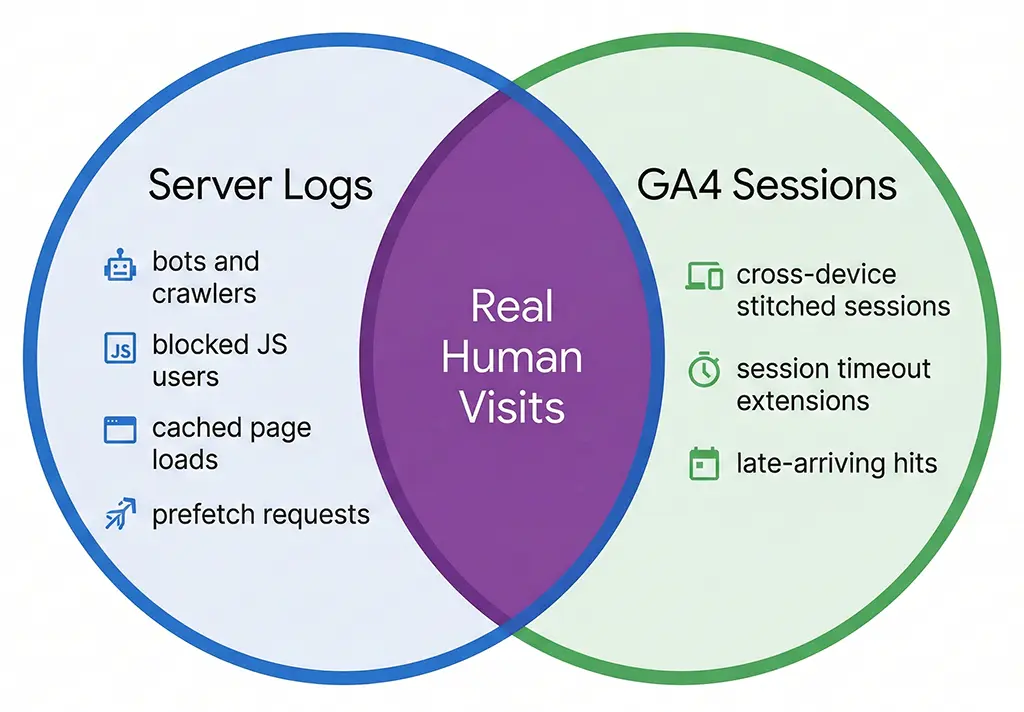
Your server log records an entry for every HTTP request that reaches Nginx — or in the case of short link redirects, every request that hits the Spring Boot application layer. It's a faithful record of network activity. It doesn't know or care whether the requester is a human, a Googlebot crawl, a health check from your load balancer, a social media link previewer, or a curl command run by a security scanner. All of those produce log entries.
GA4 sessions are something entirely different. A session is a client-side construct — it exists only when JavaScript executes in a browser, the GA4 tag fires, and a session_start event is sent to Google's collection servers. No JavaScript execution means no session. This is why the two numbers diverge so dramatically as soon as you have any meaningful non-human traffic, ad-blocker usage, or JavaScript execution failures in your audience.
The session definition itself adds another layer of complexity. GA4 uses a 30-minute inactivity timeout by default, but a session doesn't simply equal one page load. A user who visits your landing page, leaves for 25 minutes, and returns is still in the same session. A user who keeps a tab open for 4 hours while occasionally clicking around generates one session with many events. Your server log generated a request entry every time their browser fetched a resource — which could be dozens of entries for that single GA4 session.
The session_start event is not the same as a page load
This distinction matters more than most people realize. When GA4 receives a page_view event, it checks whether an active session exists for that client ID. If one does — based on the _ga cookie and the session cookie _ga_XXXXXXXX — it attaches the event to the existing session without incrementing session count. Only when no valid session exists does it fire session_start and create a new session record.
The practical implication: a user who refreshes your page 10 times in 20 minutes generates 10 server log entries and 10 page_view events in GA4, but only 1 session. Your server log will look like 10 unique requests from that user's IP; GA4 shows 1 session with 10 page views. If you're comparing raw server request counts to GA4 sessions, you're not comparing equivalent things.
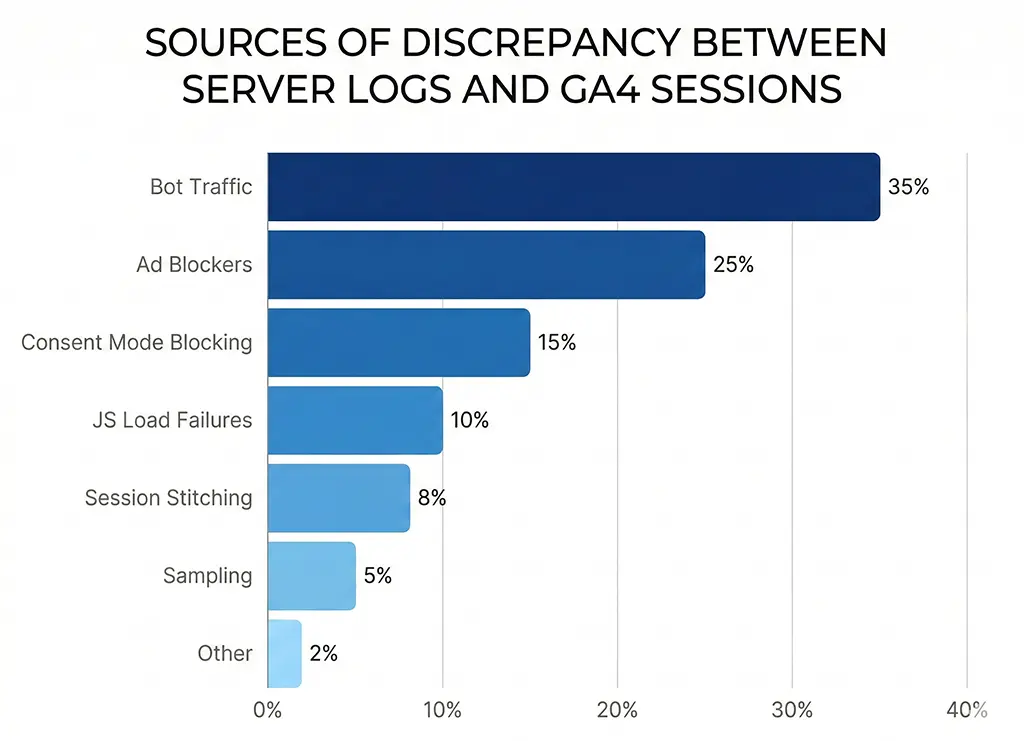
The Seven Sources of Divergence
When I work through a discrepancy between server logs and GA4 at vvd.im, I run through a checklist of seven causes. Understanding which combination applies to your situation determines what action, if any, makes sense.
1. Bot and crawler traffic
Bots are the single largest contributor to server log inflation on most sites. Search engine crawlers, feed aggregators, uptime monitors, security scanners, and link preview fetchers all hit your server and generate log entries. None of them execute JavaScript, so none appear in GA4. The ratio of bot to human traffic varies enormously by site type — a site that publishes frequently linked content can easily see 30–40% bot traffic in raw server logs.
Filtering bots from your Nginx access log is the first step toward a meaningful comparison baseline:
# /etc/nginx/nginx.conf — filter known bots from access log
# Define a map that marks bot user agents as excluded
map $http_user_agent $is_bot {
    default                     0;
    ~*Googlebot                 1;
    ~*Bingbot                   1;
    ~*Slurp                     1;
    ~*DuckDuckBot               1;
    ~*Baiduspider               1;
    ~*YandexBot                 1;
    ~*facebookexternalhit       1;
    ~*Twitterbot                1;
    ~*LinkedInBot               1;
    ~*Applebot                  1;
    ~*AhrefsBot                 1;
    ~*SemrushBot                1;
    ~*UptimeRobot               1;
    ~*curl/                     1;
    ~*python-requests           1;
    ~*Java/                     1;   # Generic Java HTTP clients
    ~*okhttp                    1;   # Android HTTP client, often automated
}

# Only log non-bot requests to the human traffic log
access_log /var/log/nginx/access_human.log combined if=$is_bot=0;

# Keep full log separately for server health diagnostics
access_log /var/log/nginx/access_full.log combined;
Even after filtering well-known bots, some traffic remains hard to classify — headless browsers running automated tests, scraper scripts that spoof legitimate user agents, and preview fetchers that send partial browser headers. A clean human-only log requires ongoing maintenance of the bot filter list.
2. Ad blockers and tracking prevention
Ad blockers that block GA4 are a persistent and growing gap source. The GA4 collection endpoint (google-analytics.com/g/collect) is blocked by uBlock Origin, Privacy Badger, and most privacy-focused browsers including Brave by default. Safari's ITP (Intelligent Tracking Prevention) doesn't block GA4 outright but restricts cookie lifetime, which can cause session fragmentation rather than total loss.
The ad-blocker gap varies by audience. On vvd.im — a developer-oriented site — I estimate ad-blocker prevalence at roughly 35–40% based on the ratio of server-logged short link clicks to GA4 sessions on the destination pages. On a general consumer site, the same ratio might be 10–15%. You cannot close this gap without server-side tracking, which is a much larger infrastructure investment than most teams justify for blog-scale traffic.
3. JavaScript load failures
Even when a user is not running an ad blocker, GA4 can fail to fire for several reasons: slow network conditions that cause the script to time out before the user navigates away, JavaScript errors earlier in the page load sequence that halt execution, Content Security Policy headers that block the GA4 script domain, and pages served from cache without network access (PWA offline scenarios). These are individually rare but collectively non-trivial on pages with complex JavaScript dependencies.
4. Consent mode blocking
If you've implemented GA4 with consent mode — required under GDPR for EU traffic — users who decline analytics consent either generate no GA4 data at all (basic consent mode) or generate cookieless, modeled pings (advanced consent mode). Either way, your server sees the request, but GA4's session count is lower. Google fills some of this gap with modeled conversions in advanced consent mode, but session counts remain understated relative to server logs.
5. GA4 session stitching and timeout logic
This one causes GA4 to report fewer sessions than you might expect even for verified human traffic. GA4 stitches sessions together across a 30-minute inactivity window. It also extends sessions when a new campaign parameter appears mid-session — a user arriving via one UTM source, leaving, and returning via a different source within 30 minutes generates a new session with the new attribution, which resets the timer. Depending on your campaign structure, this stitching can meaningfully reduce session counts compared to a naive "one log entry = one visit" interpretation.
6. Server-side redirect hops not reflected in GA4
For short link redirect services specifically, this is a significant one. Every time a user hits vvd.im/abc, the server logs a request for the short link resolution. Then Nginx or Spring Boot issues a redirect to the destination. The destination page's server logs another request. GA4 fires once, on the destination page only. If you're comparing short-link server logs to destination-page GA4 sessions, you're counting in completely different places.
7. Sampling and data thresholds in GA4 reports
Free GA4 properties apply sampling to reports that query large datasets — typically triggered when a report spans more than a few million events. The sampled number shown in a report is an estimate, not a precise count. In GA4 360 (paid), thresholds are higher. In the free tier, if you're pulling a date range that crosses sampling thresholds, your reported session count may be 5–10% off just from sampling alone, independent of any real traffic discrepancy.
Building a Reconciliation Query
Rather than picking one number over the other, I run a reconciliation that quantifies each gap source and arrives at an adjusted human-session estimate. The approach uses MariaDB to store both server log data and GA4 data (exported via the GA4 Data API or BigQuery export), then queries the delta by category.
First, the Spring Boot application stores a structured click record for every redirect, as covered in the DebugView article. This gives me a server-side baseline with bot filtering applied at the application layer:
-- MariaDB schema for click reconciliation
-- click_log stores server-side events; ga4_sessions stores GA4 Data API export

CREATE TABLE click_log (
    id            BIGINT AUTO_INCREMENT PRIMARY KEY,
    short_code    VARCHAR(20) NOT NULL,
    ua_category   ENUM('human','bot','unknown') NOT NULL DEFAULT 'unknown',
    utm_source    VARCHAR(255),
    utm_medium    VARCHAR(255),
    utm_campaign  VARCHAR(255),
    session_date  DATE NOT NULL,
    created_at    DATETIME NOT NULL DEFAULT CURRENT_TIMESTAMP,
    INDEX idx_date_code (session_date, short_code),
    INDEX idx_ua_category (ua_category, session_date)
) ENGINE=InnoDB;

CREATE TABLE ga4_sessions (
    id              BIGINT AUTO_INCREMENT PRIMARY KEY,
    session_date    DATE NOT NULL,
    utm_source      VARCHAR(255),
    utm_medium      VARCHAR(255),
    utm_campaign    VARCHAR(255),
    session_count   INT NOT NULL DEFAULT 0,
    imported_at     DATETIME NOT NULL DEFAULT CURRENT_TIMESTAMP,
    INDEX idx_date (session_date)
) ENGINE=InnoDB;
-- Reconciliation query: compare human server clicks to GA4 sessions by campaign
-- Identifies which campaigns have abnormally high or low GA4 capture rates
SELECT
    c.utm_campaign,
    c.utm_source,
    SUM(CASE WHEN c.ua_category = 'human' THEN 1 ELSE 0 END)  AS server_human_clicks,
    COALESCE(SUM(g.session_count), 0)                          AS ga4_sessions,
    ROUND(
        COALESCE(SUM(g.session_count), 0) /
        NULLIF(SUM(CASE WHEN c.ua_category = 'human' THEN 1 ELSE 0 END), 0) * 100,
        1
    )                                                          AS ga4_capture_rate_pct
FROM click_log c
LEFT JOIN ga4_sessions g
    ON  c.session_date  = g.session_date
    AND c.utm_source    = g.utm_source
    AND c.utm_campaign  = g.utm_campaign
WHERE c.session_date BETWEEN '2026-02-01' AND '2026-02-28'
GROUP BY c.utm_campaign, c.utm_source
ORDER BY server_human_clicks DESC;
A healthy GA4 capture rate for most campaigns sits between 65–85%. A campaign consistently below 60% warrants investigation — it often points to a landing page with a JavaScript error, a consent banner misconfiguration for a specific traffic source, or a redirect chain stripping UTM parameters before the destination page fires GA4. A campaign above 90% can indicate bot inflation in your "human" server log category — your UA classifier may be too permissive.
Classifying user agents in Spring Boot
The reliability of the reconciliation depends on your bot classification accuracy at the application layer. Rather than maintaining a hand-rolled regex list, I use a library in the Spring Boot service:
// pom.xml dependency
<dependency>
    <groupId>eu.bitwalker</groupId>
    <artifactId>UserAgentUtils</artifactId>
    <version>1.21</version>
</dependency>
// UA classification in the redirect controller
import eu.bitwalker.useragentutils.UserAgent;
import eu.bitwalker.useragentutils.BrowserType;

@Component
public class ClickClassifier {

    public String classify(String userAgentString) {
        if (userAgentString == null || userAgentString.isBlank()) {
            return "unknown";
        }

        UserAgent ua = UserAgent.parseUserAgentString(userAgentString);
        BrowserType browserType = ua.getBrowser().getBrowserType();

        // BrowserType.ROBOT catches major crawlers
        if (browserType == BrowserType.ROBOT) {
            return "bot";
        }

        // Additional patterns that UserAgentUtils misses
        String lower = userAgentString.toLowerCase();
        if (lower.contains("bot") || lower.contains("crawler") ||
            lower.contains("spider") || lower.contains("preview") ||
            lower.contains("facebookexternalhit") || lower.contains("slack")) {
            return "bot";
        }

        // Headless browsers — often automated even if not labeled as bots
        if (lower.contains("headlesschrome") || lower.contains("phantomjs")) {
            return "bot";
        }

        return "human";
    }
}
No classification approach is perfect. Social media preview fetchers frequently send convincing browser-like UA strings. The goal isn't perfection — it's reducing the noise enough that the reconciliation query produces meaningful signal about tracking gaps rather than bot gaps.
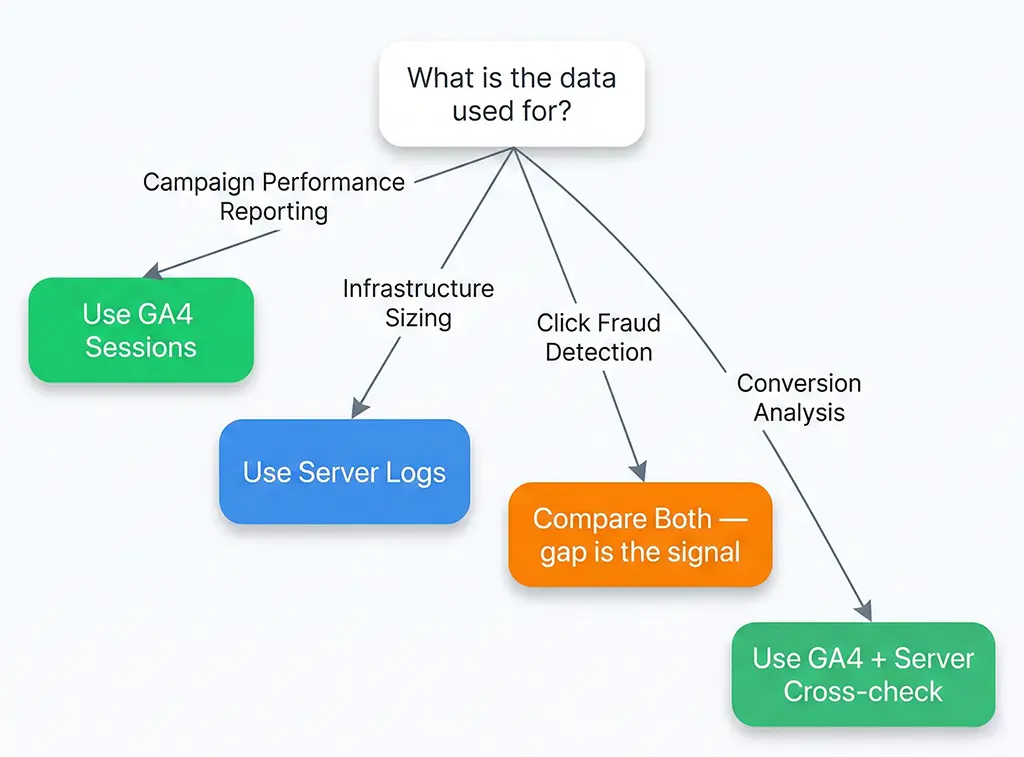
What to Do With the Gap
Once you've quantified the discrepancy and attributed it to its sources, the decision about what action to take depends on what you're using the data for.
For campaign performance reporting, GA4 sessions are usually the right number — they represent real humans who executed JavaScript, which correlates better with conversion-eligible visitors than raw server requests. A user hitting your page with an ad blocker that blocks both GA4 and your conversion pixel doesn't convert in your funnel either. The gap, in this context, is self-consistent.
For capacity planning and infrastructure sizing, server log counts are the right number. Nginx doesn't care whether a request comes from a bot or a human — it serves both. Your server needs to handle the full request volume, not just the GA4-measured subset.
For fraud detection in paid campaigns — specifically, detecting click fraud on CPC campaigns — the comparison between server logs and GA4 is itself the signal. A campaign where server logs show 10,000 clicks but GA4 shows 200 sessions has an 98% gap that strongly suggests bot-driven click inflation, not ad blocker penetration. Normal human audiences with high ad-blocker rates still show GA4 capture rates of 55–70%. A 2% capture rate is not an ad blocker problem.
The teams that get burned are the ones who pick one number and declare it authoritative without understanding what it measures. GA4 sessions are not a count of all humans who visited your site. Server log requests are not a count of all sessions. Both statements are correct, and neither number is wrong — they're just measuring different things. The reconciliation process doesn't eliminate the gap; it tells you whether the gap is explainable, expected, and stable — or a signal that something in your tracking pipeline has broken.
For the vvd.im stack, I run the reconciliation query nightly as part of a scheduled Spring Boot job that writes a summary to a MariaDB reporting table. Any campaign where the GA4 capture rate drops more than 15 percentage points from its 7-day average triggers a Slack alert. That alert has caught a broken GTM tag, a consent banner misconfiguration after a CMP update, and — twice — a legitimate redirect configuration regression that was stripping UTM parameters silently. Not one of those issues would have been visible in GA4 reports alone.