There's a gap between what your tracking implementation is supposed to do and what it's actually doing in production. GA4 reports hide this gap — they aggregate data across sessions, smooth out anomalies, and show you totals that look plausible even when individual events are malformed. DebugView doesn't aggregate anything. It shows you raw, per-device event streams in near real-time, which means it shows you exactly where things break.
I reach for DebugView in three situations: right after deploying any tracking change, when conversion numbers diverge from what I expect, and periodically as a routine audit pass on campaigns that are actively running. The workflow I've built around it has caught misfiring events, missing UTM parameters, duplicate conversion fires, and consent mode bugs that would have been invisible in standard reports for days.
Enabling DebugView Without GTM Chaos
The standard path to enabling DebugView is the debug_mode: true parameter or the GA Debugger Chrome extension. Both work, but they behave differently in ways that matter for auditing.
The Chrome extension (Google Analytics Debugger) activates debug mode by appending ?_debug=1 to every hit URL it detects. This is convenient but has a subtle problem: it only activates for the tab where you install it, and if your site opens new windows or does cross-origin redirects during a flow, debug mode can drop mid-session. I've seen this happen with OAuth flows and payment gateway redirects where the final return URL loses debug context entirely.
For auditing short link redirect chains specifically, I prefer enabling debug mode directly in the GTM tag or hardcoded in the gtag config:
// In gtag.js initialization — for debug sessions only
gtag('config', 'G-XXXXXXXXXX', {
  'debug_mode': true,
  // Forces all hits to appear in DebugView
  // Remove before pushing to production
});
If you're running Spring Boot and serving a server-side rendered page at the redirect destination, you can conditionally inject this config based on a query parameter or session attribute — useful when you want to test a specific campaign URL without affecting all users:
// Thymeleaf template — conditional debug mode injection
// Controller sets debugMode=true when ?_audit=1 is present in request
<script th:if="${debugMode}">
  window._ga4DebugMode = true;
</script>

<script>
  window.dataLayer = window.dataLayer || [];
  function gtag(){dataLayer.push(arguments);}
  gtag('js', new Date());
  gtag('config', 'G-XXXXXXXXXX', {
    'debug_mode': window._ga4DebugMode === true
  });
</script>
This approach keeps production traffic clean while letting you pass a specific campaign URL like https://vvd.im/abc?_audit=1 through your redirect chain and observe the exact event sequence that lands in DebugView.
Reading the Event Stream: What to Actually Look For
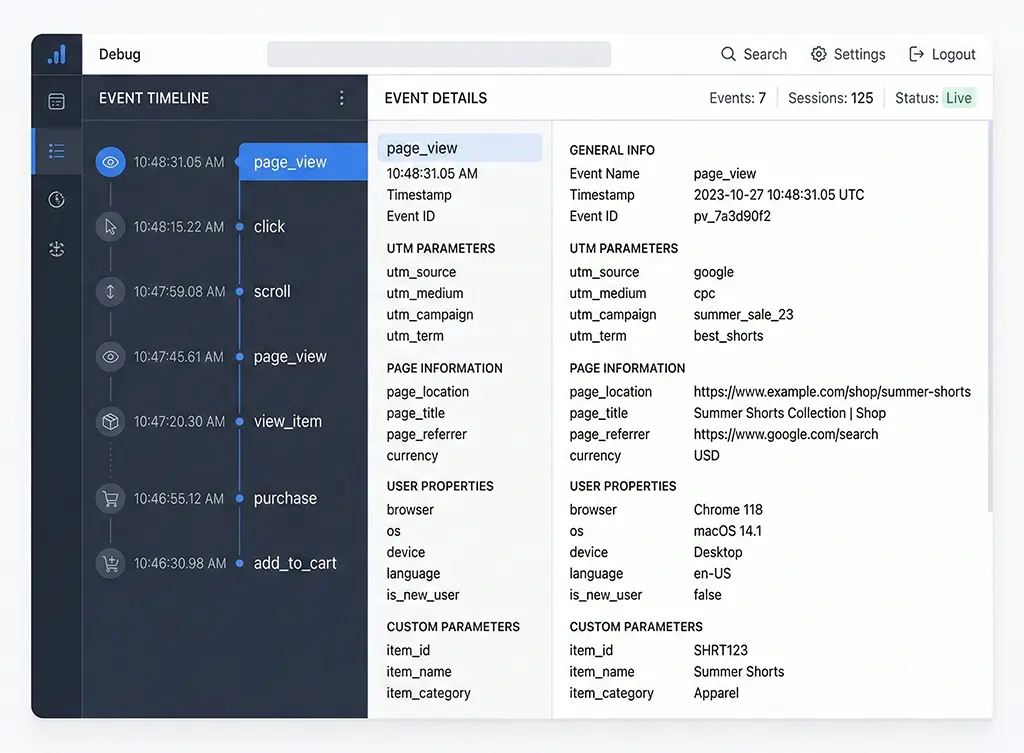
Once you're in DebugView, the default view can be overwhelming if you don't know what you're scanning for. The timeline down the center shows events in chronological order. Clicking any event opens the parameter panel on the right. Here's the specific sequence I check for a campaign link audit:
1. Confirm the first page_view carries attribution parameters
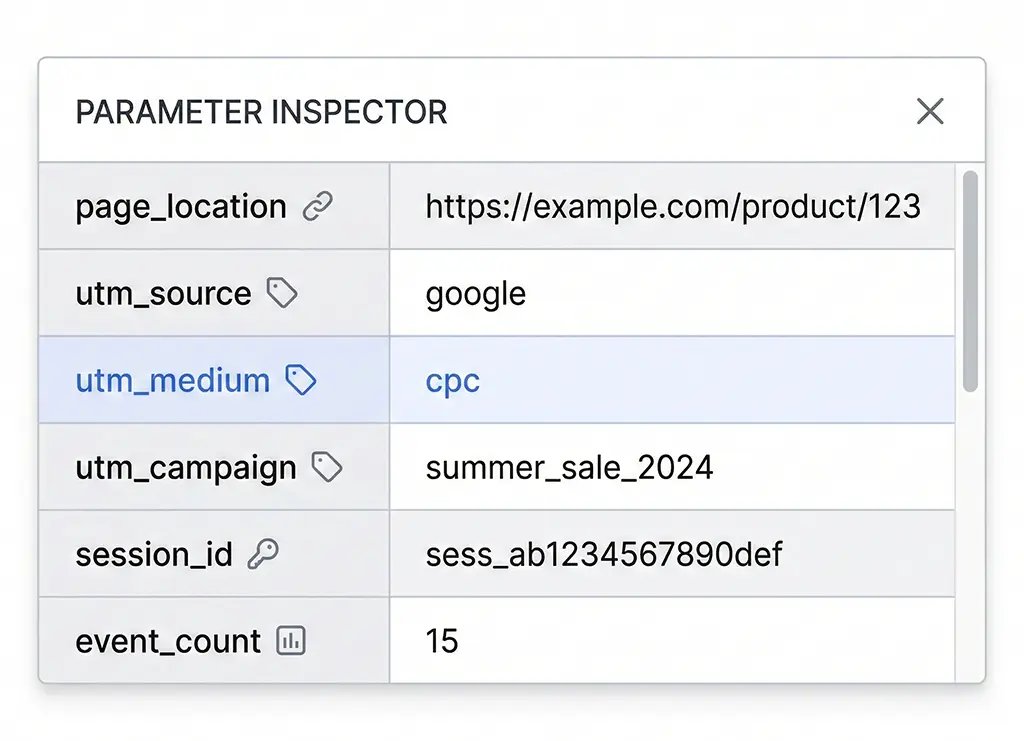
Click the very first page_view event after your redirect lands. In the parameters panel, look for page_location — it should contain the full URL including UTM parameters. If page_location shows a clean URL with no UTM params, your redirect chain is stripping them. The event fired, but attribution data is gone.
What's less obvious: also check session_traffic_source_last_click if it appears. GA4 populates this with campaign data parsed from the URL at session start. If it's empty when you expected campaign data, the parameters were missing at the moment GA4 initialized — which can happen if your gtag snippet loads before the URL is fully resolved in a client-side redirect scenario.
2. Verify event parameters match your intent
For any custom event you're sending, the parameter panel is where you confirm the actual values being transmitted — not the values you think you're sending. I've caught a case where a Spring Boot controller was URL-encoding UTM parameters a second time before forwarding them to the client. The raw value in GA4 looked like utm_campaign: summer%252Bsale instead of summer+sale, double-encoded. Completely valid from a data-transfer perspective, completely wrong for attribution matching.
3. Check for duplicate event fires
In DebugView, duplicate events within a short window (under 2 seconds) appear as stacked entries with the same event name. This is nearly impossible to spot in aggregated reports because GA4 deduplication logic sometimes — but not always — collapses them. The usual culprits: GTM trigger firing twice due to a history change listener and a page load listener both matching, or a React/Vue router that emits a navigation event that your tracking code interprets as a new pageview.
Diagnosing Attribution Failures in a Redirect Chain
This is where DebugView earns its place in an audit workflow. The failure mode I see most often with short link redirects: the page_view event fires correctly, but utm_source and related parameters are absent from the event. The analytics show the session, attribute it to direct / none, and the campaign looks like it underperformed.
To isolate where the parameters are lost, I run a sequence of curl tests against the redirect chain before auditing in DebugView:
# Step 1: Check what the short link redirect returns
curl -I "https://vvd.im/abc?utm_source=google&utm_medium=cpc&utm_campaign=spring"

# Expected: 301 or 302 with Location header containing full UTM params
# Actual failure: Location header contains only the base destination URL

# Step 2: Follow all redirects and show each hop
curl -L -I "https://vvd.im/abc?utm_source=google&utm_medium=cpc&utm_campaign=spring" \
  2>&1 | grep -E "^(HTTP|Location)"

# Step 3: If Nginx is in the chain, check rewrite rules
# A common culprit — this rewrite drops query strings silently:
# rewrite ^/abc$ https://example.com/landing break;
# Fix:
# rewrite ^/abc$ https://example.com/landing?$query_string break;
When I find that the redirect chain preserves parameters in curl but DebugView still shows no UTM data, the problem is almost always timing. The gtag snippet is initializing before the browser has processed the full URL. This happens with certain SPA frameworks and with pages that load gtag asynchronously after a client-side route change.
The Nginx configuration for the vvd.im redirect service that handles this correctly looks like this:
# /etc/nginx/sites-available/vvd.im
server {
    listen 443 ssl;
    server_name vvd.im;

    location ~ ^/([a-zA-Z0-9]{4,10})$ {
        # Capture the short code, preserve entire query string
        set $short_code $1;

        # Pass to Spring Boot for logging and resolution
        proxy_pass http://127.0.0.1:8080/resolve/$short_code?$query_string;
        proxy_set_header X-Original-Query $query_string;
        proxy_set_header X-Forwarded-For $remote_addr;
    }
}
// Spring Boot redirect controller
// Preserves all original query parameters in the destination redirect
@GetMapping("/resolve/{shortCode}")
public ResponseEntity<Void> resolveShortLink(
        @PathVariable String shortCode,
        @RequestParam MultiValueMap<String, String> queryParams,
        HttpServletRequest request) {

    String destination = linkRepository.findDestination(shortCode)
        .orElseThrow(() -> new LinkNotFoundException(shortCode));

    // Build destination URL, appending all original query params
    UriComponentsBuilder builder = UriComponentsBuilder.fromUriString(destination);
    queryParams.forEach(builder::queryParam);

    // Log the click with attribution data before redirecting
    clickLogger.record(shortCode, queryParams, request.getRemoteAddr());

    // Use 302 — 301 is browser-cached and bypasses server on repeat visits,
    // which breaks server-side click logging for returning users
    return ResponseEntity
        .status(HttpStatus.FOUND)
        .location(builder.build().toUri())
        .build();
}
One detail worth highlighting: I use 302 rather than 301 for campaign redirects. A 301 is cached by the browser, which means after the first click, subsequent visits from the same browser follow the cached redirect — bypassing your server entirely, including any click logging. DebugView will still show the GA4 events, but your server-side data loses those visits. For campaign measurement, 302 is the safer default.
Building a Repeatable Audit Checklist
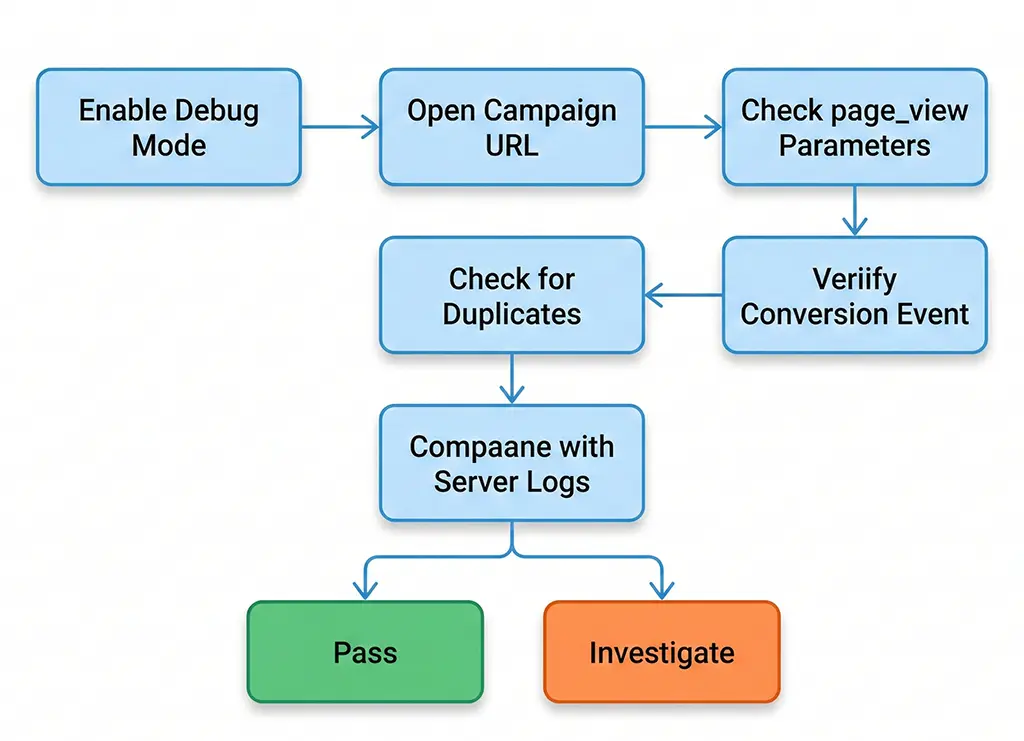
After running enough DebugView sessions, I've condensed the process into a checklist that I run on any campaign before it goes live and again 24 hours after launch. The first run catches implementation bugs; the second catches production surprises like CDN caching stripping headers, or a consent banner that's blocking GA4 initialization for a larger percentage of users than expected.
Pre-launch checklist
Enable debug mode on your test device, then walk the exact path a campaign visitor would take — from clicking the short link to completing the target conversion action. In DebugView, verify:
page_viewfires on the landing page withpage_locationcontaining UTM params- No duplicate
page_viewwithin 2 seconds of the first - Any custom engagement events (scroll depth, video play, button clicks) appear with correct parameters
- The conversion event fires exactly once after completing the target action
session_startappears early in the stream — if it's missing, GA4 failed to initialize
Post-launch audit (24 hours in)
Pull DebugView data alongside your GA4 Realtime report and your server-side click log. Compare click counts. If server logs show 1,000 clicks and GA4 shows 600 sessions, you have roughly a 40% gap — which is unusually high and worth investigating. Normal discrepancy ranges are 10–25% depending on bot filtering, consent rates, and ad blocker prevalence. Anything above 30% usually means a tracking initialization problem, not just noise.
What DebugView Can't Tell You
DebugView is a single-device view. It shows you one user's session, which means it can miss issues that only appear under specific conditions — a particular browser, a specific consent banner state, or a mobile network that proxies requests differently. The absence of a problem in DebugView is not evidence that the problem doesn't exist at scale.
For that, you need to cross-reference DebugView findings with the GA4 Event report filtered to recent traffic, and ideally with server-side click logs. DebugView tells you the mechanism is broken; the aggregated reports tell you how often. Neither alone gives you the full picture.
One thing I've started doing: logging a structured JSON record server-side for every redirect, including the full query string, referrer, and user agent. When DebugView shows a problem, I can pull the corresponding server log entries and compare what parameters the server saw versus what GA4 received. That comparison has been the most reliable way I've found to isolate where in a multi-hop redirect chain attribution data actually disappears.
// Structured click log entry — stored in Redis for fast retrieval, flushed to MariaDB hourly
public record ClickLogEntry(
    String shortCode,
    String destinationUrl,
    String queryString,         // Raw query string from incoming request
    String resolvedUtmSource,   // Parsed utm_source value
    String resolvedUtmMedium,
    String resolvedUtmCampaign,
    String referrer,
    String userAgent,
    String remoteIp,
    Instant timestamp
) {}

// Store in Redis as JSON with 24h TTL for recent audit access
// Key format: click:{UUID} — allows range scans by short code index
redisTemplate.opsForValue().set(
    "click:" + UUID.randomUUID(),
    objectMapper.writeValueAsString(entry),
    Duration.ofHours(24)
);
Having this log means that when a campaign manager reports "our paid traffic looks like direct in GA4," I can pull the server-side records for that campaign's short links, confirm the UTM parameters were present when users clicked, and narrow the diagnosis to the redirect chain or the client-side tracking initialization — rather than spending an hour guessing.
DebugView is the fastest way to confirm your fix worked. The diagnostic work that leads you to the fix usually lives in your server logs.