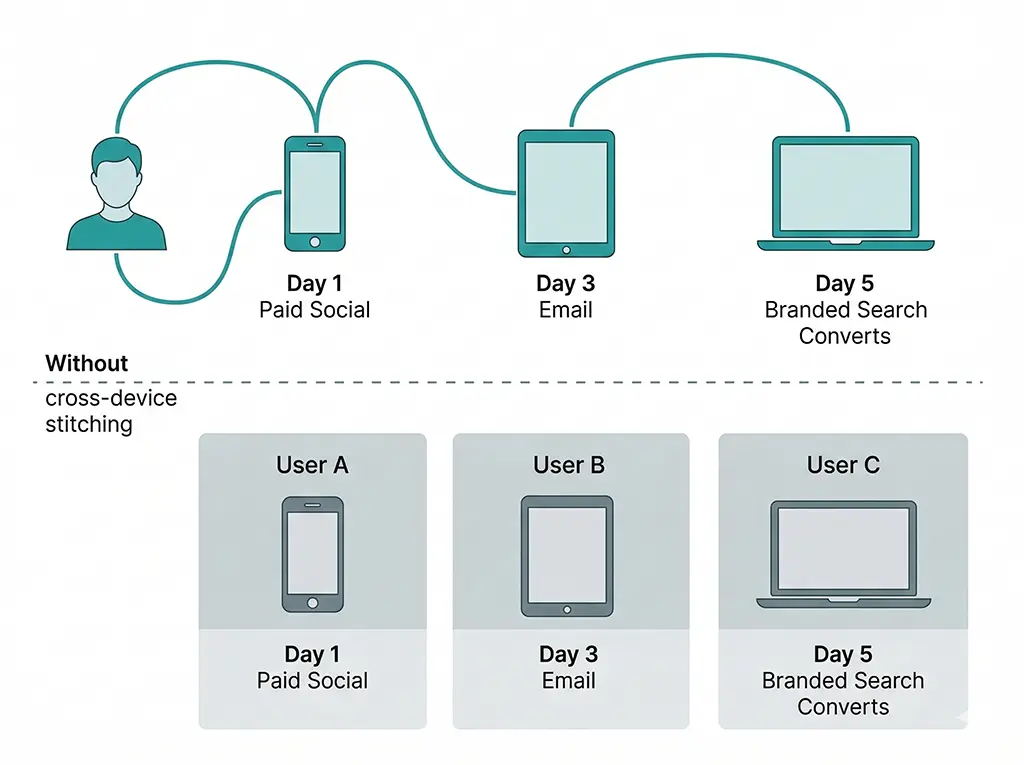
The typical cross-device journey in a B2C campaign looks something like this: a user sees a short link shared on Instagram, taps it on their phone, browses for a few minutes, and leaves. Three days later they search the brand name on their laptop, land on the site, and convert. In GA4 without cross-device stitching, that's two separate users — the mobile discovery session and the desktop conversion session. The paid social channel that drove the initial discovery gets zero credit. The branded search that closed the deal gets last-click credit for a conversion it didn't cause.
GA4 has two mechanisms designed to prevent exactly this: User-ID, where you pass a known authenticated identifier, and Google signals, where Google infers device connections from users who are signed into Google accounts and have ad personalization enabled. Neither covers the whole population. Understanding the coverage gap — and building a reasonable estimate of its size for your specific audience — is more useful than assuming the problem is either solved or unsolvable.
What GA4's Cross-Device Stitching Actually Covers
GA4 operates with three identity spaces simultaneously: device-based (the client_id cookie), user-based (your user_id if implemented), and modeled (Google signals inference). These are combined into what GA4 calls the "blended" identity model, used in reporting when you enable Google signals and User-ID.
User-ID: High Precision, Low Coverage
User-ID is the most reliable stitching mechanism. When you pass a consistent identifier — a hashed user ID from your auth system, for example — GA4 can unambiguously connect sessions across devices for authenticated users. The sessions merge, the journey is reconstructed, attribution flows correctly.
The catch is coverage. User-ID only applies to sessions where the user is logged in at the time of the visit. For most sites, that's a minority of all sessions. An e-commerce site with strong account adoption might see 40–60% of converting sessions authenticated. A content or SaaS site in discovery mode might see 5–15%. Anonymous browse sessions — which tend to cluster at the top of the funnel, precisely where cross-device behavior is most common — are uncovered entirely.
Implementing User-ID in GA4 via your Spring Boot + Thymeleaf stack means injecting the authenticated user identifier into the GA4 configuration at page render time, so it's available on the initial page load rather than set asynchronously:
<!-- Thymeleaf template: inject User-ID when session is authenticated -->
<!-- user_id must be a non-PII identifier — use hashed internal ID, not email -->
<script>
  window.dataLayer = window.dataLayer || [];
  function gtag(){ dataLayer.push(arguments); }
  gtag('js', new Date());

  /*[# th:if="${session.authenticatedUser != null}"]*/
  gtag('config', 'G-XXXXXXXXXX', {
	  // SHA-256 hash of internal user ID — never send raw PII to GA4
	  'user_id': '[[${session.authenticatedUser.hashedId}]]'
  });
  /*[/]*/

  /*[# th:unless="${session.authenticatedUser != null}"]*/
  // Anonymous session — no user_id, GA4 falls back to client_id only
  gtag('config', 'G-XXXXXXXXXX');
  /*[/]*/
</script>
Two implementation details that trip people up: first, GA4 requires the user_id to be set before any events fire — setting it after the config call in a separate script block on some page loads means some sessions get attributed without it. Second, GA4 explicitly prohibits sending personally identifiable information as the user_id value. Hashing alone isn't sufficient if the hash is trivially reversible (e.g., hashing an email address that you're also logging). Use your internal numeric user ID, hashed, not the email.
Google Signals: Broad Coverage, Opaque Mechanics
Google signals extends cross-device stitching to users who are signed into a Google account with ad personalization enabled. Google infers the device connection using its own logged-in identity graph — the same infrastructure that powers cross-device remarketing in Google Ads. The coverage is considerably wider than User-ID because it doesn't require your users to authenticate on your site.
The practical limitations are significant, though. Google doesn't tell you which sessions were stitched via signals or what the stitching confidence level is. The population covered is limited to users who are both signed into Google and have ad personalization on — a declining share as privacy settings tighten and as your audience skews toward privacy-aware users, iOS users (who tend to use Safari without Google sign-in), or non-Gmail users. GA4 also applies a data threshold: if the signals-stitched population in a given report segment is small enough to risk individual identification, GA4 suppresses the data for that segment entirely. You can see this in practice as "(other)" rows in segmented reports or unexplained drops in user counts when you apply granular filters.
Estimating the Size of the Gap You Can't See
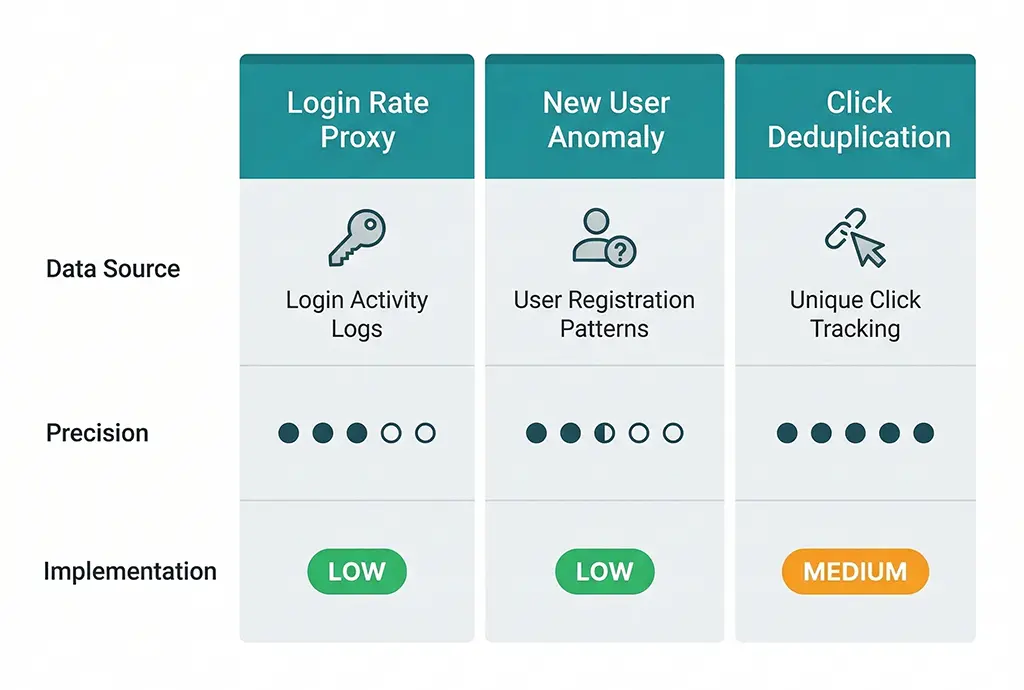
Because GA4 doesn't expose what it couldn't stitch, you have to estimate the gap indirectly. There are three estimation approaches, each with different precision and implementation cost.
Approach 1: Login Rate as a Coverage Proxy
The simplest estimate: if your User-ID implementation covers authenticated sessions, and your authenticated session rate is known, your maximum stitched coverage is bounded by that rate plus whatever Google signals adds on top. For most sites, Google signals adds 10–20 percentage points to authenticated-only stitching, but this varies significantly by audience demographics.
Measure your authenticated session rate from your own server logs — it's more reliable than GA4's user count, which is already affected by the stitching problem:
-- MariaDB: estimate authenticated vs anonymous session ratio
-- from application session logs (separate from click logs)
-- Use this as a proxy for User-ID coverage ceiling

SELECT
    DATE(session_start)                        AS session_date,
    COUNT(*)                                   AS total_sessions,
    SUM(CASE WHEN user_id IS NOT NULL
             THEN 1 ELSE 0 END)                AS authenticated_sessions,
    SUM(CASE WHEN user_id IS NULL
             THEN 1 ELSE 0 END)                AS anonymous_sessions,
    ROUND(
        SUM(CASE WHEN user_id IS NOT NULL
                 THEN 1 ELSE 0 END)
        * 100.0 / COUNT(*), 1
    )                                          AS auth_rate_pct,
    -- Estimate Google signals additive coverage (conservative: +12%)
    ROUND(
        LEAST(100,
            SUM(CASE WHEN user_id IS NOT NULL
                     THEN 1 ELSE 0 END)
            * 100.0 / COUNT(*) + 12
        ), 1
    )                                          AS estimated_total_coverage_pct
FROM app_sessions
WHERE session_start >= DATE_SUB(CURDATE(), INTERVAL 30 DAY)
GROUP BY session_date
ORDER BY session_date DESC;
The output gives you a daily estimate of what fraction of your sessions are likely stitched. The complement — 100 - estimated_total_coverage_pct — is your gap: sessions where cross-device journeys are fragmented into separate user records in GA4.
Approach 2: New User Rate Anomaly Detection
Cross-device fragmentation inflates new user counts. When a returning user visits from a new device without stitching, GA4 records them as a new user. If your new user rate is systematically high relative to your re-engagement and retention spend, fragmentation is a likely contributor.
The diagnostic: segment your new users in GA4 by channel. Channels that are predominantly top-of-funnel discovery (paid social, display) should have high new user rates — that's expected. Channels that are predominantly retention or re-engagement (email to existing customers, branded search) should have low new user rates. If email shows a high new user rate, those users are likely returning customers whose cross-device journey is fragmenting — the desktop email click isn't being connected to their prior mobile session, so GA4 calls them new.
Compare GA4's new user rate by channel against your email list's new subscriber rate (from your email platform) for the same period. If GA4's email new user rate is 35% and your email platform shows only 8% of that send went to subscribers added in the last 30 days, the gap is attributable to cross-device fragmentation plus some direct misattribution.
Approach 3: Short Link Click Deduplication
For campaigns run through a tracked short link service, the click log provides a device-agnostic view of engagement that GA4 lacks. Each click on a short link is a discrete server event, independent of the browser or device. If you log a consistent user identifier alongside the click — an email address hash from a personalized campaign link, for example — you can detect cross-device patterns directly.
The pattern: a personalized campaign link encodes the recipient's hashed identifier in a custom parameter. When the link is clicked, the redirect server logs both the click metadata (UTM, timestamp, IP hash) and the recipient identifier. If the same recipient clicks from two different IP addresses or user-agent fingerprints within the attribution window, that's an observable cross-device event — something GA4 may or may not have stitched depending on User-ID and signals coverage.
-- MariaDB: detect cross-device click patterns from campaign link logs
-- Assumes clicks table has: recipient_hash, session_hash (IP+UA), clicked_at, utm_campaign

SELECT
    recipient_hash,
    utm_campaign,
    COUNT(DISTINCT session_hash)               AS distinct_devices,
    COUNT(*)                                   AS total_clicks,
    MIN(clicked_at)                            AS first_click,
    MAX(clicked_at)                            AS last_click,
    TIMESTAMPDIFF(
        HOUR, MIN(clicked_at), MAX(clicked_at)
    )                                          AS journey_hours
FROM clicks
WHERE utm_campaign IS NOT NULL
  AND recipient_hash IS NOT NULL
  AND clicked_at >= DATE_SUB(CURDATE(), INTERVAL 30 DAY)
GROUP BY recipient_hash, utm_campaign
HAVING COUNT(DISTINCT session_hash) > 1        -- only multi-device journeys
ORDER BY distinct_devices DESC, journey_hours DESC;
The rows returned represent real cross-device journeys you can observe. The ratio of multi-device recipients to total recipients in a campaign is your empirical cross-device rate for that audience. Compare this against GA4's cross-device stitching coverage estimate from Approach 1 — the difference is your unstitched gap for that campaign's traffic.
What the Gap Means for Channel Performance Numbers
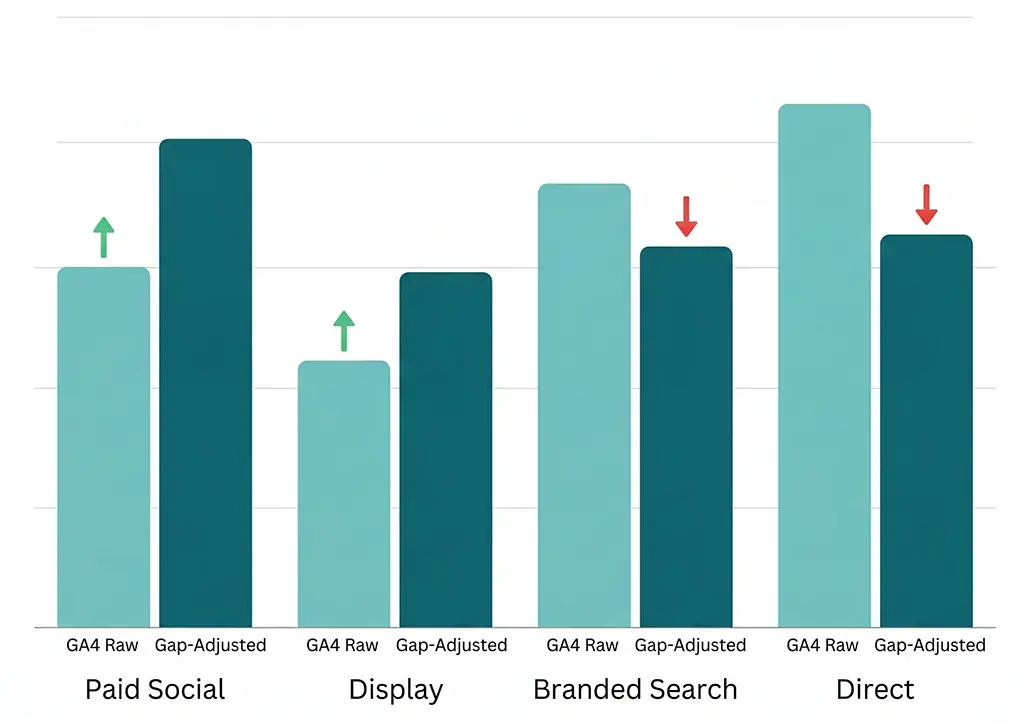
The direct consequence of unstitched cross-device journeys is that upper-funnel, mobile-heavy channels are systematically undervalued while lower-funnel, desktop-heavy channels are overcredited. The mechanism: discovery happens on mobile (paid social, display, short link click from a shared post), consideration and conversion happen on desktop (organic search, branded search, direct revisit). Without stitching, the mobile discovery session and the desktop conversion session belong to two different users. The mobile channel contributed to a journey that converts — but GA4 attributes the conversion entirely to the desktop touchpoint.
The practical read-through for common channels:
Paid social is probably more valuable than your GA4 data shows. Social browsing is predominantly mobile. If your conversion flow is desktop-heavy (B2B checkout, long-form signup), a meaningful fraction of paid social's contribution is invisible to GA4. The click happened, the awareness was created, the journey started — none of it is in the attribution path for the converting session.
Branded search is probably less valuable than your last-click data shows. Branded search is the default closer for users who discovered the brand through another channel on another device. GA4 sees the branded search, sees the conversion, and correctly attributes it to branded search under last-click. What it doesn't see is that branded search itself was driven by a prior cross-device touchpoint. This is why branded search conversion rates look so strong — they're closing journeys that started elsewhere, and the "elsewhere" is invisible.
Direct is contaminated in both directions. Unstitched returning users who skip UTM tags on their second visit land in direct, as covered in the previous article. But some of those returning visits are themselves the conversion end of a cross-device journey. So direct's conversion volume has three components: genuine brand loyalty, UTM-loss misattribution, and unstitched cross-device returning visits. Decomposing these requires the server-side click log cross-reference approach.
Building a Corrected Channel View
Given that the gap is real but not precisely measurable from GA4 alone, the most practical response is to build an adjusted channel performance view that accounts for the estimated gap rather than treating GA4's numbers as ground truth.
The adjustment approach I use for vvd.im campaign reporting: take the cross-device rate from Approach 3 (click deduplication) for the campaigns where I have personalized link data, and apply it as a correction factor to the channel breakdown. If the observed cross-device rate is 28% — meaning 28% of identified recipients clicked from more than one device — and GA4's estimated stitching coverage for that period is 40%, then roughly 60% of those multi-device journeys are fragmented in GA4. The expected impact on channel attribution is:
- First-touch channels (where the initial device click happened) are undercredited by approximately
cross_device_rate × (1 - stitching_coverage) - Last-touch channels (where the converting device session happened) are overcredited by approximately the same amount
Plugging in the numbers: 0.28 × (1 - 0.40) = 0.168, or roughly 17 percentage points of credit is flowing to last-touch channels that should be shared with first-touch channels. For a campaign where paid social is the first-touch channel and branded search is the last-touch, this means paid social's contribution is likely 17 points higher than GA4 shows — a significant reallocation if you're using GA4 data to set social budgets.
-- MariaDB: compute gap-adjusted attribution correction factor per campaign
-- Inputs: cross_device_rate from click dedup query, stitching_coverage from login proxy

SELECT
    utm_campaign,
    COUNT(DISTINCT recipient_hash)             AS total_recipients,
    -- Multi-device recipients (from earlier dedup query result)
    SUM(CASE WHEN distinct_devices > 1
             THEN 1 ELSE 0 END)                AS multi_device_recipients,
    ROUND(
        SUM(CASE WHEN distinct_devices > 1
                 THEN 1 ELSE 0 END)
        * 100.0 / COUNT(DISTINCT recipient_hash), 1
    )                                          AS cross_device_rate_pct,
    -- Correction factor: credit shift from last-touch to first-touch
    -- Assumes stitching_coverage of 40% (replace with your measured value)
    ROUND(
        SUM(CASE WHEN distinct_devices > 1
                 THEN 1 ELSE 0 END)
        * 100.0 / COUNT(DISTINCT recipient_hash)
        * (1 - 0.40), 1
    )                                          AS credit_shift_pct
FROM (
    SELECT
        recipient_hash,
        utm_campaign,
        COUNT(DISTINCT session_hash) AS distinct_devices
    FROM clicks
    WHERE utm_campaign IS NOT NULL
      AND recipient_hash IS NOT NULL
      AND clicked_at >= DATE_SUB(CURDATE(), INTERVAL 30 DAY)
    GROUP BY recipient_hash, utm_campaign
) device_counts
GROUP BY utm_campaign
ORDER BY credit_shift_pct DESC;
The credit_shift_pct column gives you a per-campaign estimate of how many percentage points of conversion credit GA4 is misassigning from first-touch to last-touch channels. Apply this as a manual adjustment layer on top of your GA4 reports when making budget allocation decisions — not as a replacement for GA4's numbers, but as a correction for a known systematic bias.
When to Stop Estimating and Start Investing in Better Infrastructure
The estimation approaches above are useful for understanding the scale of the problem and making approximate corrections. They don't solve the underlying issue. Two infrastructure investments actually reduce the gap rather than just measuring it.
Expand User-ID coverage to post-authentication landing pages. Many implementations only set user_id on pages inside the authenticated experience. If your authentication step happens mid-funnel — after a click from a campaign link, before the conversion event — there's a window where the session starts anonymously and User-ID is set late. GA4 applies User-ID retroactively within a session, but only for that session. Move the User-ID assignment as early in the post-auth flow as possible, and ensure it fires on the redirect destination page before any conversion events.
Use personalized short links for high-value campaigns. If a campaign link encodes the recipient identifier in a parameter that survives the redirect chain, you have a server-side thread connecting the click to the user across any device. This doesn't fix GA4's stitching, but it means your server-side attribution — which you're building and cross-referencing anyway — is accurate even when GA4's isn't. For email campaigns especially, this turns the click log into a reliable attribution source that operates independently of GA4's identity resolution limitations.
The realistic ceiling on cross-device attribution accuracy, even with both investments in place, is around 70–80% for most audiences. The remaining gap — anonymous users, privacy-first browsers, users who never authenticate — is genuinely unobservable. The right response to that irreducible gap isn't to pretend it doesn't exist. It's to quantify it, account for it in how you interpret channel performance, and avoid making high-confidence budget decisions from numbers that carry a known 20–30% systematic error.